
SC-PLN01 Orbital Scan
 The orbital scan panel provides an interface for visualising and interacting with data generated by orbital scans of a planet.
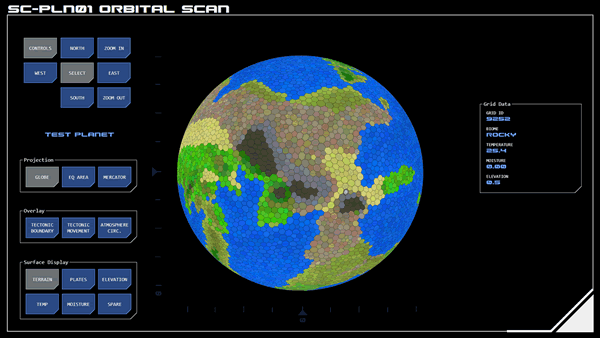
The central visualisation displays the results of automated analysis of scan data, representing the planet as a grid with each cell of the grid classified as a biome type based on the analysis. This provides operators with a high-level assessment of the planet's geography and climate, while keeping scanning and processing time to a minimum.
Each grid cell is selectable for more information.
It is expected that when drone systems become available users will be able to select grid cells of interest for further intensive scanning and analysis.
Controls
The visualisation of the planet can be navigated using the upper-left control group, which allows rotation through longitude (east-west) or latitude (north-south). Indicator scales to the left (latitude) and bottom (longitude) of the visualisation show where the current view is centred.
When projected as a globe (see below) the visualisation can also be zoomed in or out, which may assist with the accurate selection of grid cells.
Controls can be hidden by tapping the controls button. A dark blue, simplified controls button will appear that the top right of the panel above the frame. Use this to restore the controls.
Planet Selection
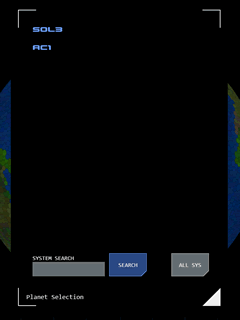
 Scanned planets can be accessed for display from a list by tapping the SELECT button at the center of the navigation group. Tapping one of the listed planets will open that planet's scan.
Only planets that have existing scans are shown.
By default, only planets in the current system are displayed. Tapping the ALL SYS button displays scanned planets across all systems (the button is in active mode when all systems are being displayed).
The search interface allows the user to enter a system code to limit the list to planets in that system.
Tapping the bottom-right frame icon closes the selection interface.
Projection
The visualisation of the planet can be projected as a globe (default) or as a flattened map (with either equal area or mercator projection).
Overlays
The visualisation can be overlaid with additional data, including:
Tectonic Boundaries: Shows the boundaries of the planet's tectonic plates, colour-coded to indicate the estimated tectonic stress at any given point..
Tectonic Movement: Overlays arrows indicating the direction and intensity of tectonic drift.
Atmospheric Circulation: Overlays arrows indicating prevailing atmospheric circulatory patterns.
Surface Display
The visualisation has a number of selectable display modes:
Terrain (default): Displays grid cells colour-coded based on their biome.
Plates: Displays underlying tectonic plates.
Elevation: Displays grid cells colour-coded by elevation. Blue cells indicate elevations of sea-level or below, with increasing depth indicated by darker cells. Brown cells indicate elevations above sea level, with increasing elevation indicated by darker cells.
Temperature: Displays grid cells colour-coded by average temperature. Sub-zero temperatures are indicated by light blue cells, otherwise temperature is represented by a colour scale ranging from yellow/light orange (cooler) to dark orange/red (hotter).
Moisture: Displays grid cells color-coded by average meteorological moisture, represented by a colour scale ranging from blue (highest moisture) to yellow (lowest moisture)
Grid Data
Tapping a grid cell on the visualisation will open a display dialogue with the key data points for that cell.
Tap away from the dialog and visualisation (ie in the back space around them) to hide the data dialogue.
Note that in globe projection it can be increasingly difficult to accurately select grid cells further away from the centre. Rotate the globe and/or zoom in to aid with the accuracy of cell selection.


